Track progress, take quizzes and save notes on this lesson.

Free forever · no card needed

Start free
Intermediate

Factors Influencing Voting Behaviour

Paper 1, 4.1 Case studies of three key general elections

Aligned to the Pearson Edexcel 9PL0 specification

Level
Intermediate
Reading time
22 min
Published
9 September 2026
On this page
  1. 1.When Class Explained Almost Everything
  2. 2.Class Dealignment and What Caused It
  3. 3.Class in 2019 and 2024: The Alignment Inverts
  4. 4.Partisanship and Partisan Dealignment
  5. 5.Age: The Sharpest Divide in Modern British Voting
  6. 6.Gender and Ethnicity as Voting Factors
  7. 7.Region: Scotland, the Red Wall and the South West
  8. 8.National Data Sources and Why They Disagree
  9. 9.Valence, Governing Competency and Turnout
  10. 10.Exam Focus: Weighing the Factors

Key takeaways

  • Class dealignment is measurable across the case studies: Ipsos MORI gave the Conservatives 59% of ABC1 voters in 1979, but YouGov found each main party's 2024 support varying by only three points between ABC1 and C2DE.
  • Age has replaced class as the sharpest divide. Labour took 49% of 18–24s and 41% of over-65s in 1997 (Ipsos MORI), but 56% of 18–24s and 14% of over-70s in 2019 (YouGov).
  • Gender differences are small overall — YouGov put Labour on 34% of men and 35% of women in 2024 — but the Conservative advantage among women seen in 1979 has gone, and the gap is widest among the young.
  • Partisan dealignment means fewer voters hold a fixed party loyalty, which is why the two main parties took just 57.4% of the vote in 2024 and smaller parties surged.
  • Valence voting explains more than ideology: voters judge governing competency, so a lost reputation for economic management — Black Wednesday in 1992, the mini-budget of 2022 — tends to precede a change of government.

When Class Explained Almost Everything

For most of the post-war period, knowing a voter's job told you how they would vote. The Oxford political scientist Peter Pulzer wrote in 1967 that class was the basis of British party politics and everything else was embellishment and detail — a judgement that was close to accurate at the time.

The alignment worked like this:

GroupTypical occupationsExpected vote
ABHigher and intermediate managerial, professionalConservative
C1Supervisory, clerical, junior managerialConservative
C2Skilled manualLabour
DESemi-skilled and unskilled manual, state-dependentLabour

Two structures held it in place. Trade union membership peaked at over 13 million in 1979 and carried Labour identity into workplaces and households. Council housing and heavy industry concentrated working-class voters in the same streets, so party loyalty was reinforced by everyone around you.

In the 1960s roughly two-thirds of voters supported their "natural" class party. The first of the three case-study elections shows what that looked like when it was still mostly working — and where it had begun to give way.

How Britain voted in 1979 (Ipsos MORI election aggregate):

GroupConservativeLabourLiberal
All voters45%38%14%
ABC159%24%15%
C241%41%15%
DE34%49%13%
Men43%40%13%
Women47%35%15%
18–2442%41%12%
55 and over47%38%13%

The middle-class Conservative lead of 35 points and the Labour lead of 15 points among DE voters are the old alignment, still doing its work. But note what age was doing in 1979: almost nothing. The youngest voters split 42–41, the oldest 47–38.

The 1979 result is usually explained by the Winter of Discontent, and rightly. The voting data adds something the narrative alone misses: the Conservatives won without gaining meaningful ground among their own class base.

Swing measures the average movement between two parties from one election to the next:

Comparing the two elections in Ipsos's published series — noting that its October 1974 column is taken from a Louis Harris poll rather than a MORI aggregate, so these swings are indicative rather than exact:

GroupOct 1974 (Con / Lab)1979 (Con / Lab)ChangeSwing to Conservative
ABC156 / 1959 / 24+3 / +5−1 (a swing to Labour)
C226 / 4941 / 41+15 / −811.5 points
DE22 / 5734 / 49+12 / −810 points
All37 / 4045 / 38+8 / −25 points

Work the C2 row through: the Conservatives gained 15 points and Labour lost 8, so the swing is — more than twice the national figure in the same series. Among ABC1 voters both parties gained slightly at the Liberals' expense, producing a swing of −1, which is to say none.

Two conclusions follow, and both are exam-grade:

  • 1979 was decided by working-class Conservative votes. The right to buy, income tax cuts and secret ballots in union elections were aimed at exactly the C2 group that delivered the swing, and the Housing Act 1980 put the right to buy on the statute book fifteen months after polling day.
  • Class voting was already weakening before anyone called it dealignment. A tied C2 vote in 1979 is not the alignment Pulzer described in 1967.

The Ipsos MORI aggregate puts the Conservatives on 45% and the actual UK result was 43.9%. Survey estimates and vote counts are different objects; the slide on national data sources sets out why they differ.

Class Dealignment and What Caused It

Class dealignment is the weakening of the class–party link. It is a process, not an event, and it has three main causes:

  • Occupational change. Manufacturing employment collapsed and service and professional work expanded, so the manual working class shrank as a share of the electorate.
  • Embourgeoisement. Rising real incomes, home ownership and the Right to Buy from 1980 gave many manual workers assets and interests that cut across the old class script.
  • Cross-cutting identities. Education, housing tenure, region and, after 2016, Leave or Remain now divide voters in ways that do not follow occupation.

By 1997 the process had gone far enough to produce a landslide. Ipsos MORI's figures come from 13,544 face-to-face interviews conducted during the campaign, between 21 March and 29 April 1997:

GroupConservativeLabourLiberal Democrat
AB41%31%22%
C137%37%18%
C227%50%16%
DE21%59%13%

Two things in that table decided the election:

  1. C1 voters split evenly. Supervisory and clerical workers had been reliable Conservative territory; in 1997 they divided 37 to 37. The commentators' shorthand for the target voter — "Mondeo man", "Worcester woman" — describes precisely this group, and New Labour's manifesto was written for it.
  2. C2 voters swung hard. Against the same series for 1992 (Conservative 39, Labour 40), the C2 vote moved by 11 points to Labour, slightly ahead of the 10.5-point national swing in that series.

The alignment did not break symmetrically. The Conservatives held a ten-point lead among AB voters even in their worst result since 1906. What collapsed was their reach into the middle and lower-middle of the class structure, and no amount of core-vote loyalty could compensate.

Class in 2019 and 2024: The Alignment Inverts

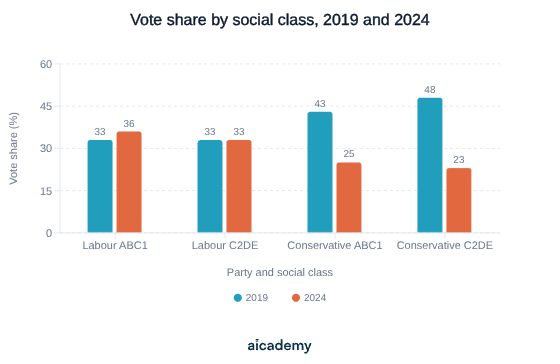
Grouped bars showing Labour and Conservative support among ABC1 and C2DE voters. Labour scored 33 per cent in both classes in 2019, then 36 and 33 per cent in 2024. The Conservatives fell from 43 and 48 per cent to 25 and 23 per cent.

Read the 2019 columns carefully. YouGov's analysis of that election put the Conservatives higher among C2DE voters (48%) than among ABC1 voters (43%), which is the exact reverse of the classic alignment.

By 2024 the class gradient had almost disappeared from each party's own support: YouGov put Labour on 36% of ABC1 voters and 33% of C2DE voters, the Conservatives on 25% and 23%. Each party's support varies by three points or less between the two groups. There is still a wide gap between the parties — Labour led by 11 points among ABC1 voters and by 10 among C2DE voters — but it is nearly the same gap in both classes, and a gap that does not vary by class is not a class effect.

Education has replaced class as the cleaner divide. In 2019 the Conservatives led Labour by 58% to 25% among voters whose highest qualification was GCSE or below, but trailed by 29% to 43% among graduates. In 2024 Labour won 42% of the graduate vote to the Conservatives' 18%, while Reform UK took 20% of C2DE voters and only 11% of ABC1 voters — a new class pattern, but not the old one.

The exam trap is to write that class no longer matters. Class-based voting has weakened and inverted; it has not vanished. Reform UK's much stronger showing among C2DE than ABC1 voters in 2024 is class voting, just not for the party the textbook expects.

Partisanship and Partisan Dealignment

Partisanship is a standing psychological attachment to a party — supporters who vote the same way whatever the manifesto says, inherited from family and reinforced by habit. Partisan dealignment is the erosion of that attachment.

It shows up in four measurable ways:

SymptomEvidence
Weaker two-party dominanceConservative and Labour took 75.7% of the vote in 2019 but just 57.4% in 2024
Volatility between electionsThe Conservatives fell from 365 seats in 2019 to 121 in 2024; Labour rose from 202 to 411
Smaller-party breakthroughsReform UK took 14.3% of the vote in 2024, the Greens 6.4%; Reform came second in 98 seats and the Greens in 40
Collapsing membershipMass party membership has fallen from millions in the 1950s to hundreds of thousands today

One caution on the second row. Official "change" columns for 2024 are calculated against notional 2019 results recalculated on the new constituency boundaries, which is why published tables show the Conservatives down 251 rather than the 244 you get by subtracting the actual totals. Quote seats or quote changes, but do not mix the two bases inside one subtraction.

The consequences run in two directions. Dealigned voters are available, so campaigns, leaders and events can move them — which makes short-term factors matter more than they did in 1964. But available voters are also detachable: a party that wins them by default, as Labour arguably did in 2024, has not won their loyalty. The May 2026 local elections, at which Labour lost around 35 councils on a projected national vote share of about 17%, showed how quickly a soft coalition can dissolve.

Partisan dealignment also explains the rise of tactical voting. Voters without a fixed loyalty are willing to lend a vote: in 1997 the Liberal Democrats won 46 seats on 16.8% of the vote having won only 20 seats on a larger 17.8% share in 1992, and in 2024 the campaign group Best for Britain advised centre-left voters on which candidate was best placed to beat the Conservatives locally.

Worth saving these ideas?

Turn what you've read into instant revision cards. Free to get started.

Make flashcards

Age: The Sharpest Divide in Modern British Voting

Age barely separated voters in 1979 and separated them only mildly in 1997. Since 2017 it has been the strongest social predictor of vote choice in Britain.

ElectionLabour, youngest groupLabour, oldest groupSpread
197941% (18–24)38% (55+)3 points
199749% (18–24)41% (65+)8 points
201956% (18–24)14% (70+)42 points
202441% (18–24)20% (70+)21 points

The 1979 and 1997 rows are Ipsos MORI's; the 2019 and 2024 rows are YouGov's. The oldest band is not the same group in every row, which is one of the reasons figures from different sources should not be subtracted from one another.

YouGov's analysis of the 2019 election found that every additional ten years of age raised the chance of voting Conservative by about nine points and lowered the chance of voting Labour by about eight. Its analysis of 2024 again found age the most important social factor.

Why the gap exists is contested, and a good answer separates two explanations:

  • Life-cycle effects. As people acquire property, savings and dependants they acquire an interest in stability and lower taxation, so they drift right as they age. If this is right, the gap is permanent but individuals move across it.
  • Cohort effects. A generation shaped by high housing costs, student debt and, after 2016, a Brexit vote it mostly opposed may carry those attitudes with it. If this is right, today's young voters will not become Conservative simply by ageing.

The 2024 shape is sometimes offered as evidence for the cohort reading, because Labour's support held up across every age group below 50 instead of tapering steadily with age as it had in 2017 and 2019. On its own that is weak evidence: Pearson's own case study attributes the same flattening to Labour's repositioning under Starmer, and one election's change of shape cannot separate a cohort effect from a change in what the party was offering. Separating them needs a long, consistent series, which is what the British Election Study exists to supply.

Turnout compounds the effect. Older voters vote more reliably, so their preferences are amplified. YouGov estimated 18–24 turnout at 58% in 2017, up from 43% in 2015 — a rise that helped deny Theresa May her majority, and a reminder that youth turnout is volatile rather than uniformly low.

Gender and Ethnicity as Voting Factors

Gender. The headline gap is now small: YouGov put Labour on 34% of men and 35% of women in 2024, and the Conservatives on 23% and 26%. The same near-parity was found in 2017 and 2019.

The interesting part is that this is a change, and the case-study elections show when it happened. Using the Conservative lead over Labour in Ipsos MORI's series:

ElectionConservative lead among menConservative lead among womenDifference
1979+3+129 points
1992+4+106 points
1997−14−122 points

Until the 1980s women were noticeably more likely than men to vote Conservative, partly because women live longer and older voters leaned right. By 1997 that advantage had all but gone, and Labour's landslide was built on men and women in almost equal measure.

The divide is now generational instead. In 2019, 28% of 18–24 year-old men voted Conservative against only 15% of women the same age. In 2024, Reform UK polled better among men than women, and younger men were more likely than younger women to vote Conservative or Reform. A gender gap invisible in the national average is substantial among the under-25s.

Ethnicity. Ethnic minority voters have historically been considerably more likely to vote Labour than white voters, a pattern usually attributed to Labour's record on race relations legislation, its strength in urban areas and its association with public sector employment. Ethnic-minority samples in national surveys were for decades too small to break down reliably, which is why this factor is normally evidenced from recent elections.

The 2024 election showed how conditional the relationship has become. Labour's vote share fell by 25 percentage points in the 21 constituencies where more than a fifth of the population is Muslim, in response to the party's stance on the Israel–Hamas conflict. Four pro-Palestinian independents were elected in such seats, and the shadow Health Secretary Wes Streeting held Ilford North by a margin of barely 500 votes. A group that had been treated as a reliable Labour bloc withdrew support over a single issue — which is partisan dealignment operating within an ethnic minority electorate.

The Commons elected in 2024 was the most diverse yet: 14% of MPs were from ethnic minority backgrounds, up from 10% in 2019 and close to the population share, and more than 40% were women, up from 34%.

Region: Scotland, the Red Wall and the South West

Region matters under first past the post because votes are counted constituency by constituency. Where support is concentrated, seats follow; where it is evenly spread, they do not — which is why Reform UK's 14.3% in 2024 produced five seats and the Liberal Democrats' 12.2% produced 72.

Scotland is the clearest case of regional realignment, and the case-study elections mark the stages.

ElectionConservative in ScotlandLabour in ScotlandSNP in Scotland
197922 seats on 31.4%44 seats on 41.5%2 seats on 17.3%
19970 seats on 17.5%56 seats on 45.6%6 seats on 22.1%
20245 seats37 seats9 seats

In 1979 Scotland still behaved like the rest of Britain: two-party politics, with the SNP collapsing from 11 seats to 2 after it helped bring the Callaghan government down. By 1997 the Conservatives held more than a sixth of the Scottish vote and not one of its 72 seats — the sharpest illustration in modern British politics of what happens to evenly spread support under first past the post. Then Scotland detached from the two-party system altogether: the SNP took 56 of 59 seats in 2015 and held 48 in 2019, before falling to nine in 2024 as voters who wanted the Conservative government out returned to Labour, after a period in which the SNP had three leaders in fourteen months. At the Scottish Parliament election of 7 May 2026 the SNP won 57 seats, Labour 17 and Reform UK 17.

The red wall describes historically Labour seats from north Wales through the north Midlands, Yorkshire and the north-east. They swung Conservative in 2019 over Brexit and mistrust of Jeremy Corbyn, on what Pearson's own case study called conditional support. When "levelling up" produced little, seats including Darlington, Redcar, Stoke-on-Trent Central, Bolsover and Scunthorpe returned to Labour in 2024.

The south and south-west moved the other way. The Liberal Democrats recaptured affluent, Remain-leaning seats the Conservatives had held for decades, reaching 72 seats — their best result ever, and the strongest for their tradition since the Liberal Party won 158 seats in 1923.

Wales produced the sharpest recent shift of all. At the Senedd election of 7 May 2026, fought under a new closed proportional list system, Plaid Cymru won 43 of 96 seats with 35.4% and Reform UK 34 with 29.3%, while Labour took nine seats on 11.1%. Labour left government in Wales for the first time since 1999.

National Data Sources and Why They Disagree

Ballots are secret, so nobody counts how women, graduates or 18-year-olds voted. Every demographic figure in this lesson is a survey estimate, and the specification expects you to know where those estimates come from and why they vary.

SourceWhat it isStrengthLimit
British Election Study (BES)Academic study run at every general election since 1964: a face-to-face random-probability survey plus a large internet panelThe only continuous series back to 1964, and it checks reported turnout against the marked electoral registerSlow; the full data appears long after the result
Ipsos MORIAggregates of its own campaign polls, published as the How Britain Voted series; the run is presented from October 1974, but that first column comes from a Louis Harris poll and MORI's own aggregates begin in 1979A consistent quota-sample method across fifty years, which is why the 1979, 1992 and 1997 tables above all come from itInterviews are taken during the campaign, so they measure intention, not the act
YouGovLarge online panel surveys conducted after polling daySamples in the tens of thousands — more than 42,000 for its 2024 analysis — allow fine slices by age, education and classPanel members volunteer, and answers are collected once the result is known

Four reasons the same election produces different numbers:

1. They cover different populations

Ipsos MORI's 1979 aggregate has the Conservatives on 45% against a UK result of 43.9%. Much of that difference is coverage: How Britain Voted means Great Britain, while the headline result is UK-wide and includes Northern Ireland, where the mainland parties do not stand.

2. Timing changes the question

A campaign poll records intention; a post-election survey records recall. More people tell surveys they voted than actually did, and recall drifts towards the winner. That is why the BES validates reported turnout against the marked register rather than taking respondents at their word.

3. The instruments are not standardised

ABC1 and C2DE are market-research gradings of occupation, not official statistics. Ipsos MORI's 1997 tables report AB (Conservative 41, Labour 31) separately from C1 (37 each); collapse them into a single ABC1 figure and a real difference disappears. Age bands vary the same way — 55+, 65+ and 70+ appear in the tables in this lesson, and they are not the same people.

4. The cleavage you choose decides the answer

In 2024 the class instrument shows Labour on 36% of ABC1 voters and 33% of C2DE voters, which reads as almost no division. The education instrument, applied to the same electorate in the same election, shows Labour on 42% of graduates against the Conservatives' 18%. Neither is wrong; they are measuring different things.

Naming the source is worth marks. "YouGov's post-election analysis of 2024 put Labour on 41% among 18–24s" shows the examiner you know a figure is an estimate; "41% of young people voted Labour" does not.

Valence, Governing Competency and Turnout

Social characteristics explain less than they once did, so most political scientists now treat UK elections as valence contests. Voters largely agree on the ends — a growing economy, working public services, secure borders — and choose on governing competency, meaning their judgement of which party can actually deliver.

Three worked illustrations, one from each direction:

  1. Competence lost, and not regained. After the pound was forced out of the ERM on 16 September 1992, the Conservatives' lead on economic management transferred to Labour and stayed there for the rest of the Parliament, even as growth returned and unemployment fell. A competence reputation is easier to lose than to rebuild, which is why the 1997 swing appeared in the data years before polling day.
  2. Competence lost by delivery failure. A government that sets its own tests can fail them publicly. Of the five pledges Sunak set out at the start of 2023, only the inflation target had been met by the summer of 2024, and the electorate was invited to mark the government's homework against a list the government itself had written.
  3. Competence as an opposition asset. Labour's 2024 campaign was built on reassurance rather than enthusiasm. Its purpose was to look capable of governing, which is a valence strategy rather than an ideological one.

Disillusion and apathy are the other side of the same coin. Turnout in 2024 was 59.7%, the lowest since 2001, and lowest of all in northern England, the Midlands and Northern Ireland. Voters from poorer socio-economic backgrounds were again less likely to vote — one plausible reading being that they see less prospect of any government improving their lives. 2024 was also the first general election requiring photographic ID at the polling station, and around 400,000 people were reported to have been prevented from voting by the requirement, with poorer, less educated and ethnic minority voters disproportionately affected. That figure counts everyone the requirement kept away, which is a much larger group than those actually refused a ballot at the desk.

A strong essay links the two ideas: dealignment makes voters available, valence judgements decide where they go, and disillusion decides whether they turn up at all.

Exam Focus: Weighing the Factors

1. Listing factors instead of ranking them

An answer that describes class, then age, then gender, then region, without saying which mattered most and why, will struggle on AO3. Lead with a claim — "age has displaced class as the primary social cleavage" — and use the data to test it.

2. Answering only from the most recent election

4.1 asks for the voting patterns of three elections, and 1997 is compulsory. The strongest evidence for dealignment is a comparison across them: an ABC1 Conservative lead of 35 points in 1979 against a three-point class spread in 2024 makes the argument in one line. A 2024-only answer cannot show a trend.

3. Confusing class dealignment with partisan dealignment

One is about the class–party link, the other about loyalty to any party. They are separate spec terms with separate definitions, and using them interchangeably costs precision marks.

4. Writing that class no longer matters at all

The safer and more accurate claim is that the class–party alignment has weakened and in places inverted. The Conservatives led among C2DE voters in 2019, and Reform UK took nearly twice as large a share of C2DE as ABC1 voters in 2024.

5. Quoting statistics with no year and no source

Every figure needs an election attached and, where it is a survey estimate rather than a count, the house that produced it: "YouGov's analysis of the 2024 election put Labour on 41% among 18–24s". Mixing figures from two sources inside one comparison is a further trap, because their samples, class definitions and age bands differ.

6. Ignoring turnout

Vote shares describe those who voted. Because turnout varies sharply by age and social group, differential turnout can matter as much as differential preference — the 2017 rise in 18–24 turnout to an estimated 58% is the clearest example.

7. Treating social factors and valence as rivals to be chosen between

They operate at different levels. Social characteristics shape a voter's starting position; valence judgements about competence move them from it. The strongest essays explain the interaction rather than picking a side and defending it flatly.

Key terms

Class dealignment
The weakening of the link between a voter's social class and the party they support, so that occupation predicts vote choice far less reliably than it once did.
Partisan dealignment
The erosion of long-term, habitual attachment to a single party, leaving more voters willing to switch between parties from one election to the next.
Governing competency
Voters' judgement of how capably a party runs the country, or would run it from opposition — assessed on delivery and results rather than on ideology.
Disillusion and apathy
Withdrawal from political life caused by a loss of belief that politics can change anything, showing up as low turnout and weak awareness of current affairs.
Valence issue
A question on which voters broadly agree about the goal, so the electoral contest is about which party is trusted to achieve it rather than about the aim itself.
Salience
How much weight voters give an issue when deciding how to vote, which can change sharply between elections even when opinion on the issue does not.
Social class (ABC1 / C2DE)
The occupational grouping used by UK pollsters: ABC1 covers professional, managerial and clerical work; C2DE covers skilled manual work, semi-skilled and unskilled work, and those reliant on state benefits.
Swing
The average movement of support between two parties from one election to the next, calculated as half the difference between the change in each party's share.

Frequently asked questions

Class dealignment is the weakening of the link between a voter's social class and the party they back. Partisan dealignment is the weakening of long-term loyalty to any party. They often occur together but are separate processes and carry separate marks.

Age. YouGov's analysis of both the 2019 and 2024 general elections found age the strongest social predictor of vote choice, while Labour and Conservative support differed by only a few points between the ABC1 and C2DE class groups in 2024.

From surveys, not from the count — ballots are secret. The British Election Study, Ipsos MORI's How Britain Voted series and YouGov's post-election panels are the main sources, and they differ on method, timing and class definitions, so their figures rarely match exactly.

Generate revision on any topic you study

Type any topic you're studying and Aicademy generates a complete lesson, quiz, and flashcard set, personalised to your level.

Lessons on anything

Structured, level-matched lessons on any topic you study

Practice quizzes

Find out what you actually know before the exam does

Flashcard sets

Lock in key concepts with instant revision cards

Ask Aica

Stuck on something? Get a clear explanation, any time

Prev

Three Key General Elections

Next

The Media and Opinion Polls

Related lessons

16 min

Lesson

Three Key General Elections

A-Level Politics · Pearson Edexcel 9PL0

2 hours ago

15 min

Lesson

The Media and Opinion Polls

A-Level Politics · Pearson Edexcel 9PL0

2 hours ago

14 min

Lesson

Who Votes for Whom in the USA

A-Level Politics · Pearson Edexcel 9PL0

2 hours ago

Top students don’t revise more. They revise what counts.

Start revising free

Free to start. No card needed.