Track progress, take quizzes and save notes on this lesson.

Free forever · no card needed

Start free
Intermediate

Who Votes for Whom in the USA

Paper 3A, 5.2.3 Coalition of supporters for each party

Aligned to the Pearson Edexcel 9PL0 specification

Level
Intermediate
Reading time
14 min
Published
9 September 2026
On this page
  1. 1.Reading the 2024 Result
  2. 2.Race and Ethnicity
  3. 3.Religion
  4. 4.Gender
  5. 5.Education
  6. 6.How the Four Factors Interact
  7. 7.Are the Coalitions Shifting?
  8. 8.Exam Focus: Common Mistakes

Key takeaways

  • The specification requires race, religion, gender and education to be analysed through one presidential campaign since 2000; the 2024 Trump–Harris contest is the fullest recent example.
  • Race remains the strongest single predictor: in 2024 Trump took an estimated 54% of white voters and 12% of black voters, while Harris won 83% of the African American vote, down from Biden's 91% in 2020.
  • Education has become the fastest-moving divide. Trump won an estimated 56% of non-college-educated voters and 42% of college-educated voters in 2024.
  • The gender gap is real but smaller than the education gap within genders: Harris took an estimated 53% of women, yet non-college-educated women split about 63–35 for Trump.
  • No single factor decides a vote. Trump's 13-point gain among Latino voters in 2024 came from immigration, inflation and social conservatism cutting across ethnicity.

Reading the 2024 Result

Section 5.2.3 asks for one presidential election campaign since 2000, analysed by race, religion, gender and education. The 2024 Trump–Harris contest is the fullest recent case, and the reference window widened to 2000 in Issue 4 of the specification.

CandidatePopular voteShareElectoral College
Donald Trump77,284,11849.8%312
Kamala Harris75,017,61348.3%226

Turnout was about 64% of the voting-eligible population, slightly below 2020. Trump increased his vote share in every state except Washington, and won all seven swing states — Arizona, Georgia, Michigan, Nevada, North Carolina, Pennsylvania and Wisconsin.

A health warning that earns marks. Figures for how demographic groups voted come from exit polls and post-election surveys, not from ballot papers, and analysts do not claim the data are exact. Write "an estimated 54%" rather than "54%", and use the direction and size of a gap rather than treating a single percentage as fact. Examiners reward candidates who show they understand where the numbers come from.

The four factors below are not independent of one another. A voter is not simply female or simply non-graduate, and the most interesting patterns in 2024 appear where two factors pull against each other.

Race and Ethnicity

Race remains the strongest single predictor of the presidential vote, but 2024 showed it weakening at the edges.

Group2024 (estimated)2020 comparison
White voters54% for TrumpTrump won 63% of non-college-educated white voters
African American voters83% for Harris; 12% for TrumpBiden won 91% in 2020
Latino voters56% for Harris; Trump up about 13 points on 2020Trump's 2020 share was 13 points lower
Older African American votersAbout 5% for Trump

The African American vote. Harris took an estimated 83% of African American voters, down from the 91% who supported Biden in 2020. In Detroit's Wayne County, where more than a third of the population is black, she won 63% — five points behind Biden's 2020 tally. The Democratic hold on this group is still overwhelming, but the margin thinned in exactly the places that decide Michigan.

The Latino shift is the headline finding. Trump's support among Latino voters rose by about 13 points on 2020, and the gain was concentrated among men. The explanation given in the post-election analysis is that ethnicity was competing with three other pressures: many settled Latino voters were as hostile to illegal immigration as white voters; they were disproportionately exposed to the cost-of-living crisis; and socially conservative attitudes on family and religion pulled towards the Republicans.

That is the analytical lesson of the whole topic. A demographic label predicts a vote only while the issues that made the group cohesive stay salient.

Religion

Religion divides the American electorate in a way that has no close British parallel, and the specification asks for it explicitly. Two things are being measured: which tradition a voter belongs to, and how often that voter attends services. The second is the stronger predictor.

Read this slide as direction and gap, not as percentages. Surveys classify religion by self-reported affiliation and by frequency of attendance, and different survey houses draw those categories differently, so published shares for the same group at the same election can differ by several points. State which way a group leaned in 2024 and how wide the gap was, and say the figures are estimates. That is worth more than a precise number you cannot stand behind.

GroupHow it leaned in 2024Why
White evangelical ProtestantsStrongly RepublicanAbortion, judicial appointments, religion in public life
White Catholics and mainline ProtestantsDivided, frequent attenders leaning RepublicanObservance matters more than denomination
Black Protestant churchgoersStrongly DemocraticRace cuts across observance
Latino Catholics and evangelicalsMoved towards TrumpSocial conservatism, reinforced by immigration and living costs
Voters with no religious affiliationStrongly DemocraticAbortion rights and the separation of church and state

The pattern is a religiosity gap rather than a denominational one. Within the white electorate, how often a voter attends predicts the vote better than which church they attend, and the gap between frequent attenders and the religiously unaffiliated is one of the widest in American politics.

What the 2024 campaign did with it. Both campaigns fought on ground that religion had shaped. Trump chose J. D. Vance, a social conservative who campaigned openly on traditional family values, as his running mate, and moved from backing a national abortion ban to leaving abortion law to individual states — a formula built to hold observant conservatives without losing voters who opposed a ban. Harris built heavily on abortion rights after Dobbs, but the issue ranked below the economy in most voters' priorities, as the gender slide sets out. The religiously charged issue both sides expected to decide the election moved fewer votes than either campaign assumed.

The organised expression of religious conservatism is the religious right — a movement of conservative religious voters and organisations, broadly aligned with the Republican Party, that campaigns to put traditional family and moral commitments into law. Three moments show it operating:

  • 2020. The Republican convention platformed an anti-abortion activist among speakers chosen to represent traditional small-town American values. A week before polling day the Senate confirmed Amy Coney Barrett, a Catholic conservative, to the Supreme Court, creating a 6–3 majority of Republican appointees and raising the prospect that Roe v Wade would be reversed.
  • 2022. Dobbs v Jackson Women's Health Organization delivered exactly that reversal, which the religious right had pursued since 1973.
  • 2024. With Roe already gone, the movement's goal shifted from overturning it to defending state-level bans, which is why Trump's states-rights formula was enough to keep its support.

Religion does not operate alone, and race is what cuts across it. Black Protestant churchgoers are among the most religiously observant Americans and among the most reliably Democratic voters. The religiosity effect therefore holds strongly among white voters and much less so among black voters. In 2024 the same cross-cutting appeared among Latino Catholics and evangelicals, whose social conservatism helped move them towards Trump.

Gender

The gender gap is one of the most stable features of US voting, and 2024 both confirmed and complicated it.

GroupTrumpHarris
Men58%
Women46%53%
Non-college-educated women63%35%

Harris led among women by an estimated seven points, and Trump led among men by a wider margin. But her support among female voters was two points below Biden's in 2020, and Trump's 46% among women was slightly better than his 2020 performance. The lead she held was not large enough to offset his advantage among men.

Why abortion did not deliver more. The Harris campaign built heavily on abortion rights, and polling earlier in 2024 suggested only about one American in ten wanted an outright ban. The issue was popular but not decisive, because the economy and living standards ranked higher for most women voters. Non-college-educated women, the group most exposed to food and energy prices, split about 63–35 for Trump.

The candidate factor. Some commentators argued that a section of the electorate was unwilling to vote for a woman in a country that had not previously elected one, and that Trump's emphasis on strong masculine leadership in a crisis spoke to that feeling. Treat this as a contested explanation and say so: it is difficult to measure, and it competes with the simpler account that Harris was judged on the Biden administration's economic record.

For comparison, the estimated gender gap in 2020 was between 8 and 12 points, so 2024 sits within the recent range rather than breaking it.

Worth saving these ideas?

Turn what you've read into instant revision cards. Free to get started.

Make flashcards

Education

Education is the newest of the four factors and the one moving fastest.

GroupTrump 2024Harris 2024
College-educated voters42%53%
Non-college-educated voters56%

In 2020 the same pattern was already clear: Trump won 63% of non-college-educated white voters, and raised his support among non-college-educated non-white voters from 20% to 25% between 2016 and 2020, while college-educated non-white women preferred Biden by an average of 22 points.

Why the divide has opened. Trump's promise to protect American industries and jobs with tariffs spoke directly to unemployed and lower-paid workers, at a time when the cost-of-living crisis dominated. A University of Chicago survey of 120,000 voters found three in ten saying their family's finances were falling behind and nine in ten worried about food prices. Meanwhile the Republican campaign framed the Democrats as fixated on identity politics rather than everyday living costs, and celebrity endorsements from Taylor Swift and Michelle Obama arguably reinforced the impression of a remote liberal elite.

Harris, in the judgement of Senator Bernie Sanders among others, lacked Biden's rapport with working-class voters — a striking criticism from inside her own party about the group the Democrats once took for granted.

How the Four Factors Interact

The mark-scheme skill in this topic is showing that the factors cross-cut. The chart below sets the 2024 groups side by side.
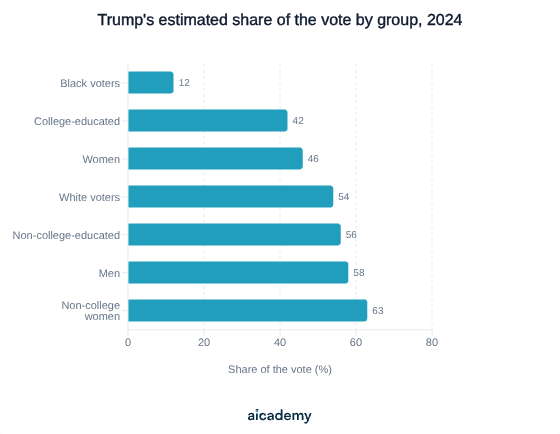
Horizontal bars of Trump's estimated 2024 vote share rising from 12 per cent of black voters to 42 per cent of college-educated voters, 46 of women, 54 of white voters, 56 of non-graduates, 58 of men and 63 of non-college-educated women.

Two observations follow directly from the shape of that chart.

Education outweighs gender within a gender. Trump took an estimated 46% of women overall but about 63% of non-college-educated women. The education gap inside the female electorate is wider than the gender gap across the whole electorate. An answer that treats gender as a single bloc misses this.

Worked example — the cross-pressured voter. Consider a non-college-educated Latino man in Arizona in 2024. Ethnicity historically pulled him towards the Democrats; education, gender and economic insecurity pulled towards Trump; and if he attended church regularly, religion pulled the same way. Three of the four spec factors pointed one direction and one pointed the other. Trump won Arizona. Explaining that voter, rather than listing four percentages, is what AO2 rewards.

(Extra context — age and region are not among the four factors named in 5.2.3, so use them only in support. In 2024 an estimated 43% of under-30s backed Trump while his support among the over-65s slipped, and he ran further ahead in rural than urban areas. In 2020 a suburban shift towards Biden in Pennsylvania, Michigan, Wisconsin and Georgia was decisive, taking Georgia Democratic for the first time since 1992.)

Are the Coalitions Shifting?

The Democratic coalition that elected Biden in 2020 was built from African Americans, moderate suburban voters, blue-collar working-class voters and younger liberals. In 2024 three of those four groups moved.

GroupMovement between 2020 and 2024
African American votersHarris on 83%, down from Biden's 91%
Latino votersTrump up about 13 points
Under-30 votersAn estimated 43% for Trump, up on 2020
Over-65 votersSlight movement away from Trump
Non-college-educated votersFurther towards Trump, building on 2016 and 2020

Is this realignment or a single bad election? Two readings are available and both are defensible.

  • Realignment. The education divide has widened at three consecutive elections, which is a trend rather than an accident. If the Republican Party is becoming the party of non-graduates of every ethnicity, and the Democratic Party the party of graduates, the shift among Latino and younger male voters is the leading edge of a durable change.
  • A verdict on incumbency. Just under half of those who voted backed Trump because they were dissatisfied with the Democrats' record, wanted change, and were unconvinced by what Harris offered. On that reading the movement reflects inflation and a weak campaign, and could reverse when the same groups judge a Republican administration's record.

The evidence to settle this does not yet exist. The midterm elections fall on 3 November 2026 and, as of September 2026, have not taken place. A responsible answer says which reading it finds stronger and identifies what evidence would confirm it.

Exam Focus: Common Mistakes

1. Using an election that falls outside the window

Issue 4 moved the reference point from 1992 to 2000. Any campaign from 2000 onwards is available, but the further back you go the weaker the currency of the material. Build your answer on 2024 and use 2020 for comparison.

2. Listing percentages instead of explaining them

A figure alone earns AO1. The mark comes from explaining why a group votes as it does — Latino voters and immigration, non-graduates and tariffs, observant voters and abortion — and then weighing the factors against each other.

3. Presenting exit-poll estimates as hard facts

The data are surveys. Write "an estimated 83%" and comment on the reliability. Polls in recent cycles have tended to understate Trump's swing-state support, which is itself a useful evaluative point about the data behind every figure in this topic.

4. Treating one factor as decisive

The four factors interact. Non-college-educated women voted very differently from college-educated women; black Protestant voters cut against the religiosity pattern. Cross-cutting evidence is the clearest way to show analytical control.

5. Treating religion as the weakest of the four factors

Religion carries the same weight in 5.2.3 as race, gender and education. Argue it through the religiosity gap, the way race cuts across observance, and what the two 2024 campaigns did about abortion after Dobbs. Where you do not have a percentage you trust, give the direction and the width of the gap and label them as estimates.

6. Assuming a single election proves realignment

2024 was one contest fought during a cost-of-living crisis. Set the realignment reading against the incumbency reading, state which you find stronger, and say what would settle it.

Key terms

Coalition of supporters
The combination of social groups whose votes a party relies on to build a national majority.
Gender gap
The difference between the share of men and the share of women supporting a given candidate or party.
Diploma divide
The growing voting difference between Americans who hold a college degree and those who do not.
Exit poll
A survey of voters taken as they leave polling places, used to estimate how different groups voted before official data exists.
Realignment
A lasting change in which social groups attach themselves to which party, as opposed to a one-off swing at a single election.
Swing state
A state close enough that either party could win it, where shifts in group support decide the Electoral College.

Frequently asked questions

Any campaign since 2000 is allowed under Issue 4, but 2024 gives the richest material on all four factors and the most current examples. Use one campaign in depth and bring in 2020 only for comparison.

It is the gap between voters with and without a college degree. In 2024 an estimated 56% of non-college-educated voters backed Trump against 42% of college-educated voters, a split that has widened at every election since 2016.

Trump's support among Latino voters rose about 13 points on 2020. Settled Latino voters were often as hostile to illegal immigration as white voters, were more exposed to inflation, and many hold socially conservative views that align with the Republicans.

Generate revision on any topic you study

Type any topic you're studying and Aicademy generates a complete lesson, quiz, and flashcard set, personalised to your level.

Lessons on anything

Structured, level-matched lessons on any topic you study

Practice quizzes

Find out what you actually know before the exam does

Flashcard sets

Lock in key concepts with instant revision cards

Ask Aica

Stuck on something? Get a clear explanation, any time

Prev

The Democratic and Republican Parties

Next

Interest Groups in the USA

Related lessons

14 min

Lesson

The Democratic and Republican Parties

A-Level Politics · Pearson Edexcel 9PL0

2 hours ago

13 min

Lesson

US Presidential and Congressional Elections

A-Level Politics · Pearson Edexcel 9PL0

2 hours ago

22 min

Lesson

Factors Influencing Voting Behaviour

A-Level Politics · Pearson Edexcel 9PL0

2 hours ago

Top students don’t revise more. They revise what counts.

Start revising free

Free to start. No card needed.