Track progress, take quizzes and save notes on this lesson.

Free forever · no card needed

Start free
Intermediate

Trophic Levels and Biomass Transfer

4.7.4.1 Trophic levels·4.7.4.2 Pyramids of biomass·4.7.4.3 Transfer of biomass (Biology only)

Aligned to the AQA 8461 specification

Topic
Ecology
Level
Intermediate
Reading time
9 min
Published
16 June 2026
Updated
1 July 2026
On this page
  1. 1.What Trophic Levels Are
  2. 2.Producers, Consumers and Decomposers
  3. 3.Pyramids of Biomass
  4. 4.Constructing a Pyramid of Biomass to Scale
  5. 5.The 1% and 10% Rules: How Biomass Is Transferred
  6. 6.Why Biomass Is Lost Between Levels
  7. 7.Calculating Efficiency of Biomass Transfer
  8. 8.Common Exam Mistakes

Key takeaways

  • Trophic levels are feeding stages numbered from 1: producers (level 1) make their own food by photosynthesis, then primary, secondary and tertiary consumers feed along the chain.
  • Decomposers break down dead plant and animal matter by secreting enzymes, releasing mineral ions back into the soil that producers reabsorb.
  • A pyramid of biomass shows the biomass at each trophic level drawn to scale, with producers as the widest bar at the bottom and each level above narrower.
  • Producers transfer about 1% of incident light energy into biomass, and only about 10% of the biomass at one trophic level is transferred to the level above.
  • Biomass is lost between levels because not all of an organism is eaten, some food is egested as faeces, and material is used in respiration and lost in excretion.

What Trophic Levels Are

A trophic level is a feeding stage in a food chain. Every organism occupies a level based on how it gets its energy, and the levels are numbered starting from 1.

The number rises as you move along the chain, away from the original light source captured by plants.

LevelNameWhat it doesExample
1ProducerMakes its own food by photosynthesisGrass, algae, oak tree
2Primary consumerHerbivore — eats producersRabbit, caterpillar
3Secondary consumerCarnivore — eats herbivoresFox, ladybird
4Tertiary consumerCarnivore — eats other carnivoresEagle, sparrowhawk

A producer is an organism (a plant or alga) that makes its own food using light energy. Producers are always trophic level 1.

A carnivore at the top of a chain with no predators of its own is called an apex predator — for example, a lion or a sparrowhawk.

Producers, Consumers and Decomposers

Each organism is grouped by how it obtains food, not just by what it eats.

  • Producers (level 1) — plants and algae. They use light energy in photosynthesis to make glucose, building their own biomass from carbon dioxide and water.
  • Consumers (levels 2 and above) — animals that cannot make their own food, so they eat other organisms.
    • Primary consumers are herbivores (eat producers).
    • Secondary consumers are carnivores that eat herbivores.
    • Tertiary consumers are carnivores that eat other carnivores.

Decomposers sit outside this numbered ladder but are vital to the ecosystem.

A decomposer (for example a bacterium or fungus) breaks down dead plant and animal matter by secreting enzymes into the environment. The small soluble molecules produced then diffuse back into the decomposer.

When decomposers break down dead material they release mineral ions back into the soil. Plants reabsorb these ions, so decomposers recycle the nutrients that producers depend on.

Pyramids of Biomass

Biomass is the mass of living material in an organism (or in a whole trophic level), usually measured as dry mass.

A pyramid of biomass is a diagram showing the relative amount of biomass at each trophic level of a single food chain. It is drawn as a stack of horizontal bars, to scale, with each bar's width proportional to the biomass at that level.

In a pyramid of biomass, trophic level 1 (the producers) is always drawn at the bottom, and each level above it is narrower.

Because biomass falls sharply at each step up the chain, the bars get narrower as you go up, giving the classic pyramid shape:
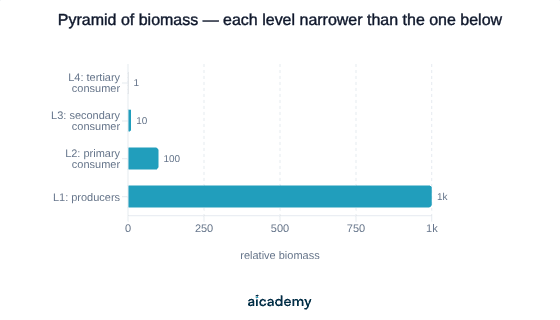
Unlike a pyramid of numbers, a pyramid of biomass is almost always a true pyramid shape — even one large producer, such as an oak tree, still holds far more biomass than all the organisms feeding on it.

Constructing a Pyramid of Biomass to Scale

Pyramids must be drawn to scale, so you first choose a scale, then convert each biomass figure into a bar width.

Worked example — draw a pyramid for this food chain. Biomass is the dry mass per square metre:

Trophic levelOrganismBiomass (g/m²)
1Grass10000
2Rabbits1000
3Foxes100

Step 1 — choose a scale. Let 1 cm represent 2000 g/m².

Step 2 — convert each biomass to a bar width using :

LevelBiomass (g/m²)Bar width (cm)
1 (grass)10000
2 (rabbits)1000
3 (foxes)100

Step 3 — draw the bars centred on top of each other, widest (level 1) at the bottom:
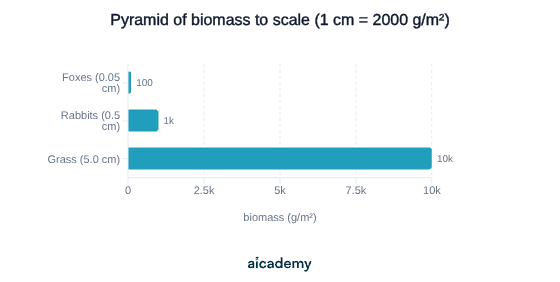
Always state the scale next to the pyramid (for example "1 cm = 2000 g/m²"). A scaled pyramid with no key cannot be read correctly.

Worth saving these ideas?

Turn what you've read into instant revision cards. Free to get started.

Make flashcards

The 1% and 10% Rules: How Biomass Is Transferred

Two key figures describe how energy and biomass move through a chain.

At the start of the chain, producers capture only a small fraction of the light that reaches them.

Producers (mostly plants and algae) transfer about 1% of the incident energy from light into biomass through photosynthesis. The other ~99% is reflected, passes straight through the leaf, or is the wrong wavelength to be used.

Between trophic levels, only a small fraction of biomass passes upward.

Only approximately 10% of the biomass at one trophic level is transferred to the level above it.

Worked example — applying the 10% rule down a chain. Suppose the producers contain 10000 kJ of energy in their biomass. Taking 10% at each step:

Trophic levelEnergy in biomassHow it is found
Producers (L1)10000 kJstarting value
Primary consumers (L2)1000 kJ10% of 10000
Secondary consumers (L3)100 kJ10% of 1000
Tertiary consumers (L4)10 kJ10% of 100

Each arrow up the chain multiplies the biomass by . After three transfers only kJ remains — just 0.1% of what the producers started with.

Why Biomass Is Lost Between Levels

Roughly 90% of biomass is not passed to the next level. There are three reasons, and you should be able to explain all of them.

  1. Not all of an organism is eaten. Predators leave bones, fur, roots or woody stems. That biomass never enters the next level (decomposers break it down instead).
  2. Not all eaten material is absorbed. Some ingested food passes through the gut without being absorbed and is egested as faeces.
  3. Absorbed material is used and lost as waste. Large amounts of glucose are used in respiration, releasing energy for movement, growth and keeping warm. The waste products leave the body:
    • carbon dioxide and water lost in respiration;
    • water and urea lost in urine (excretion).

Three losses to memorise: not all eaten, egestion (faeces), and respiration / excretion (urine). Warm-blooded animals lose especially large amounts to respiration because they use energy to maintain body temperature.

Only the biomass left over after all these losses — about a tenth — is built into the consumer's body and becomes available to the next level.

Calculating Efficiency of Biomass Transfer

The efficiency of transfer between two levels is the percentage of available biomass that actually becomes biomass in the level above.

Worked example 1. A field of grass has a biomass of 20000 kJ. The rabbits feeding on it build 1600 kJ of biomass. Find the efficiency.

Worked example 2. Of 500 g of plant biomass available, 45 g is transferred into caterpillars.

Both results are close to the ~10% figure, as expected.

Why this limits food chains. Because so little biomass passes up each step, there is not enough left to support many levels. After four or five transfers the remaining biomass is too small to sustain another population, which is why food chains rarely have more than 4 or 5 trophic levels, and why top predators are few in number. It also explains the pyramid shape: each level supports a smaller mass — and usually a smaller number — of organisms than the one below it.

(Extra context — not required by AQA 8461.) This is also why a given area of farmland feeds far more people growing crops directly than rearing animals on those crops: each trophic level added wastes ~90% of the biomass.

Common Exam Mistakes

1. Saying producers transfer 10% of light energy

The 1% figure is for producers capturing incident light. The 10% figure is for biomass passing between trophic levels. Mixing these up is a frequent error — keep them separate.

2. Forgetting respiration as a loss

Many answers only mention faeces. Respiration is usually the largest loss: glucose is broken down to release energy, and carbon dioxide and water are lost. Always include it.

3. Confusing egestion with excretion

Egestion is the removal of undigested food as faeces (it was never absorbed). Excretion is the removal of metabolic waste the body produced, such as urea in urine. They are different losses.

4. Drawing a pyramid of biomass without a scale

The bars must be drawn to scale and the scale stated. An unlabelled sketch with arbitrary bar widths cannot be marked as an accurate pyramid of biomass.

5. Putting the wrong level at the bottom

Level 1 — the producers — is always the bottom, widest bar. Building the pyramid upside down loses marks even if the figures are right.

6. Slips in the efficiency formula

Divide biomass transferred by biomass available, then multiply by 100. Dividing the wrong way round (available ÷ transferred) gives a percentage above 100%, which is impossible for a transfer.

Key terms

Trophic level
A feeding stage in a food chain, numbered from 1, based on how an organism gets its energy.
Producer
An organism, a plant or alga, that makes its own food using light energy; always trophic level 1.
Primary consumer
A herbivore that eats producers, occupying trophic level 2.
Decomposer
An organism such as a bacterium or fungus that breaks down dead plant and animal matter by secreting enzymes, then absorbing the small soluble molecules produced.
Biomass
The mass of living material in an organism or trophic level, usually measured as dry mass.
Pyramid of biomass
A diagram of horizontal bars drawn to scale showing the relative biomass at each trophic level of a single food chain.
Egestion
The removal of undigested food as faeces, food that was never absorbed by the body.
Excretion
The removal of metabolic waste the body produced, such as urea in urine.

Frequently asked questions

Roughly 90% is lost because not all of an organism is eaten (bones, fur, roots), some eaten food is egested as faeces without being absorbed, and absorbed material is used in respiration and lost as waste in urine. Only about a tenth is built into the body.

Divide the biomass transferred to the next level by the biomass available in this level, then multiply by 100. For example, if 1600 kJ is built from 20000 kJ of grass, efficiency is 1600 divided by 20000 times 100, which equals 8%.

The 1% figure is the fraction of incident light energy that producers transfer into biomass by photosynthesis. The 10% figure is the fraction of biomass transferred between trophic levels. Mixing these up is a frequent exam error, so keep them separate.

Generate revision on any topic you study

Type any topic you're studying and Aicademy generates a complete lesson, quiz, and flashcard set, personalised to your level.

Lessons on anything

Structured, level-matched lessons on any topic you study

Practice quizzes

Find out what you actually know before the exam does

Flashcard sets

Lock in key concepts with instant revision cards

Ask Aica

Stuck on something? Get a clear explanation, any time

Prev

Deforestation and Global Warming

Next

Food Security and Sustainable Food Production

Related lessons

10 min

9 min

Lesson

The Water and Carbon Cycles

AQA GCSE Biology · AQA 8461

1 month ago

Top students don’t revise more. They revise what counts.

Start revising free

Free to start. No card needed.