Probability — Basics and Possibility Spaces

Aligned to the Pearson Edexcel 1MA1 specification
- Topic
- Probability
- Level
- Foundational
- Reading time
- 7 min
- Published
- 12 June 2026
- Updated
- 16 August 2026
On this page
Key takeaways
- Theoretical probability is P(event) = favourable outcomes / total equally likely outcomes; it always lies between 0 (impossible) and 1 (certain).
- For mutually exclusive exhaustive events, all probabilities sum to 1; use P(A complement) = 1 - P(A) to find the probability an event does not happen.
- Relative frequency estimates probability from experiments: relative frequency = frequency of outcome / total trials. Larger samples give more reliable estimates.
- In a tree diagram, multiply probabilities along a branch (AND) and add across branches for the same outcome (OR); all branches at each stage must sum to 1.
- In a Venn diagram, place the intersection count in the overlapping region only; do not include it again in the outer circle regions.
Frequency Tables and Frequency Trees (P1)
Two-way tables record outcomes across two categories simultaneously.
| Cats | Dogs | Total | |
|---|---|---|---|
| Female | 8 | 12 | 20 |
| Male | 6 | 14 | 20 |
| Total | 14 | 26 | 40 |
; (conditional — see combined probability lesson)
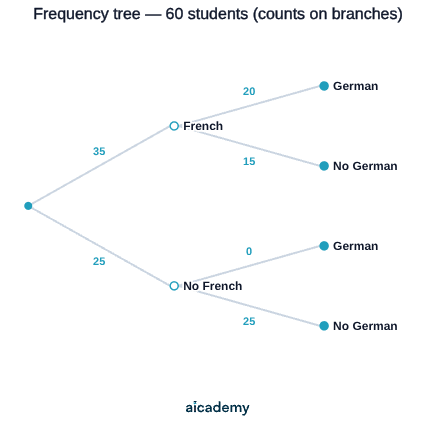
Frequency trees show how a sample is divided step by step. At each branch, the frequencies must add to the parent frequency.
Worked example — 60 students: 35 study French, of whom 20 also study German; 25 study neither (neither French nor German).
Tree: 60 total → 35 French, 25 not French. Of 35 French: 20 also German, 15 French only. Of 25 not French: 0 study German (given). Total studying German . ✓
Venn Diagrams and Set Notation (P6)
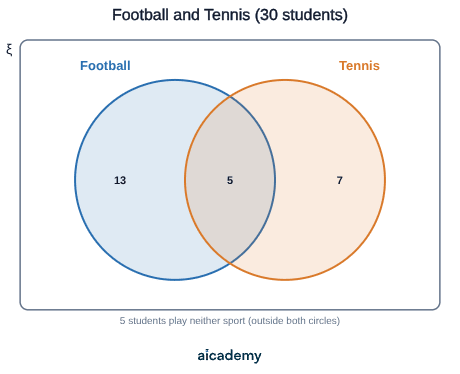
A Venn diagram shows sets as overlapping circles within a rectangle (the universal set ).
| Symbol | Meaning |
|---|---|
| or (or both) — union | |
| and — intersection | |
| not — complement | |
| number of elements in |
Worked example — 30 students: 18 play football (), 12 play tennis (), 5 play both.
; ;
✓
Something not quite clicking?
Ask Aica to explain any part of this differently. Free, takes 30 seconds.
Possibility Spaces and Tree Diagrams (P6, P7)
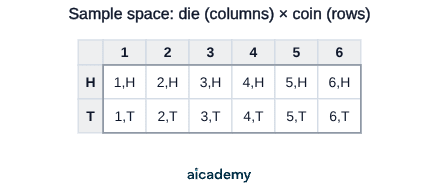
Sample space diagrams (grids) list all outcomes for two combined experiments.
Worked example — roll a fair die and flip a fair coin. Construct the sample space.
— 12 equally likely outcomes.
✓
Tree diagrams show sequential experiments with branching.
Worked example — a bag has 3 red and 2 blue balls. Two balls are drawn with replacement.
Branch probabilities: , at every draw (replacement restores the bag).
✓
Key terms
- mutually exclusive events
- Events that cannot occur at the same time; their probabilities add to give the probability of either occurring.
- exhaustive events
- A set of events that covers all possible outcomes; their probabilities sum to 1.
- relative frequency
- An experimental estimate of probability calculated as the number of times an outcome occurs divided by the total number of trials.
- expected frequency
- The predicted number of times an event will occur in n trials, calculated as P(event) x n.
- sample space
- The complete set of all possible outcomes for an experiment, often shown as a list, grid, or tree diagram.
- complementary probability
- P(A complement) = 1 - P(A); the probability that event A does not occur.
Frequently asked questions
Theoretical probability is calculated from equally likely outcomes using the formula P = favourable/total. Relative frequency is estimated from actual experiments as frequency/trials. As the number of trials increases, relative frequency tends towards the theoretical value.
Identify the cell(s) matching the event and divide by the total frequency, not the row or column total, unless the question specifies a conditional probability.
Add the circle-only regions and the intersection, then subtract from the total. For example, with 30 students and sets F and T: n(neither) = 30 - n(F only) - n(T only) - n(F and T).
Generate revision on any topic you study
Type any topic you're studying and Aicademy generates a complete lesson, quiz, and flashcard set, personalised to your level.
Lessons on anything
Structured, level-matched lessons on any topic you study
Practice quizzes
Find out what you actually know before the exam does
Flashcard sets
Lock in key concepts with instant revision cards
Ask Aica
Stuck on something? Get a clear explanation, any time
Vectors
Combined and Conditional Probability
Related lessons
7 min
Combined and Conditional Probability
Edexcel GCSE Mathematics · Pearson Edexcel 1MA1
4 months ago
7 min