Track progress, take quizzes and save notes on this lesson.

Free forever · no card needed

Start free
Intermediate

Reaction Profiles and Activation Energy

4.5.1.2 Reaction profiles

Aligned to the AQA 8462 specification

Level
Intermediate
Reading time
6 min
Published
2 July 2026
On this page
  1. 1.Why Reactions Need a Push to Start
  2. 2.Reading a Reaction Profile
  3. 3.The Exothermic Profile
  4. 4.The Endothermic Profile
  5. 5.Drawing and Labelling a Profile in the Exam
  6. 6.Common Exam Mistakes

Key takeaways

  • A reaction profile shows the relative energies of the reactants and products, the activation energy and the overall energy change as the reaction proceeds.
  • Activation energy is the minimum energy that colliding particles must have for a reaction to occur; it is the height of the hump on a reaction profile.
  • In an exothermic reaction the products are at a lower energy than the reactants, so the overall energy change is negative and energy is released.
  • In an endothermic reaction the products are at a higher energy than the reactants, so the overall energy change is positive and energy is absorbed.
  • Reactions happen only when particles collide with at least the activation energy, which is why not every collision leads to a reaction.

Why Reactions Need a Push to Start

Chemical reactions only happen when particles collide with each other, and only some of those collisions cause a reaction. A collision leads to a reaction only if the particles hit with enough energy to break the existing bonds.

The activation energy is the minimum amount of energy that colliding particles must have for a reaction to occur. If particles collide with less than this, they simply bounce apart unchanged.

Activation energy = the minimum energy needed to start a reaction. It explains why some reactions need a spark or heating before they begin, even when the products store less energy than the reactants.

A mixture of petrol vapour and air, for example, can sit unreacted until a spark supplies the activation energy; then combustion runs on its own. The activation energy is the barrier that has to be overcome before reactants can turn into products, and a reaction profile is the diagram that shows this barrier.

Reading a Reaction Profile

A reaction profile (energy level diagram) plots energy on the vertical axis against the progress of the reaction on the horizontal axis. It shows three things at once:

  • the relative energies of the reactants and the products,
  • the activation energy, and
  • the overall energy change of the reaction.

The line starts at the energy of the reactants, rises to a peak, and falls to the energy of the products. The peak represents the point where bonds are breaking and forming.

Feature on the profileWhat it represents
Left-hand levelEnergy of the reactants
Right-hand levelEnergy of the products
Height from reactants to the peakActivation energy
Vertical gap between reactants and productsOverall energy change

The curve rising to the peak and then falling shows the energy as the reaction proceeds. Reading a profile is a matter of comparing the two levels and measuring the hump, as the next two slides show for each type of reaction.

The Exothermic Profile

In an exothermic reaction the products are at a lower energy than the reactants. Energy is released to the surroundings, so the overall energy change is negative. The curve ends below where it started.
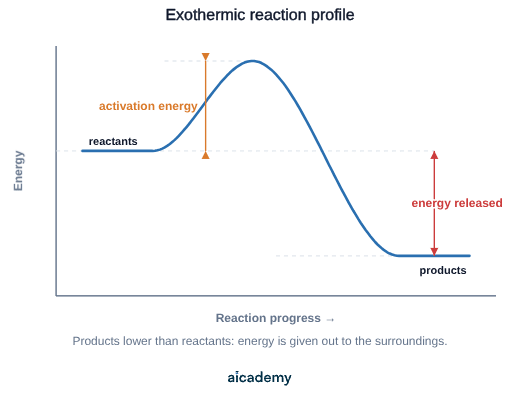
The diagram shows the reactants starting high, the curve climbing over the activation energy barrier, and the products settling at a lower level. The vertical drop from the reactant level to the product level is the energy given out to the surroundings.

The activation energy is still the height from the reactants up to the peak, even though the products end up lower. A reaction can be exothermic overall and still need an initial input of energy to start.

Because the products are lower in energy, an exothermic reaction transfers energy to the surroundings and the temperature of the surroundings rises. This is the profile shape for combustion, neutralisation and most oxidation reactions.

The Endothermic Profile

In an endothermic reaction the products are at a higher energy than the reactants. Energy is taken in from the surroundings, so the overall energy change is positive. The curve ends above where it started.
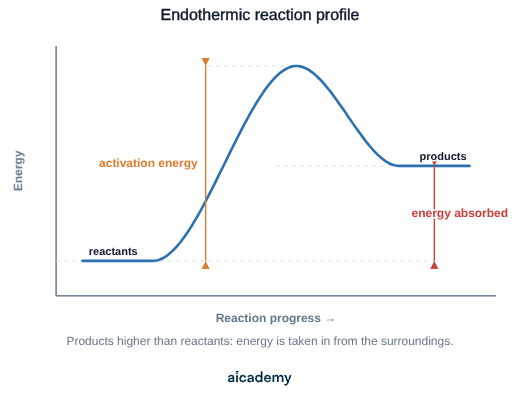
Here the curve rises over the activation energy barrier and then settles at a level higher than the reactants. The vertical rise from the reactant level to the product level is the energy absorbed from the surroundings.

For an endothermic reaction the activation energy is measured from the reactants up to the peak, and the overall energy change is the upward step to the products. Both are positive quantities on this diagram.

Because the products are higher in energy, energy is taken in from the surroundings and the temperature of the surroundings falls. Thermal decomposition follows this shape.

Worth saving these ideas?

Turn what you've read into instant revision cards. Free to get started.

Make flashcards

Drawing and Labelling a Profile in the Exam

A common exam task is to draw a reaction profile and label it. Marks are awarded for the correct shape and the correct labels, so a neat sketch with clear arrows scores well.

Follow this checklist:

  1. Draw axes: energy going up the side, "progress of reaction" along the bottom.
  2. Draw a level line for the reactants and a level line for the products at the correct relative heights (products lower for exothermic, higher for endothermic).
  3. Join them with a curve that rises to a peak between the two levels.
  4. Mark the activation energy as the vertical arrow from the reactant level up to the peak.
  5. Mark the overall energy change as the vertical arrow between the reactant and product levels.

A frequent error is measuring the activation energy from the bottom of the graph instead of from the reactant level. It is measured from the reactants up to the peak.

Worked reading. A profile shows reactants at 300 units and products at 120 units, with the peak at 460 units. The activation energy is units. The overall energy change is units, a negative value, so the reaction is exothermic.

Common Exam Mistakes

1. Measuring activation energy from the axis

Activation energy is the height from the reactant level to the peak, not from the bottom of the diagram. Draw the arrow starting at the reactants, not at zero energy.

2. Putting the products on the wrong side

For an exothermic reaction the products must be lower than the reactants; for an endothermic reaction they must be higher. Drawing them the wrong way round reverses the meaning of the whole diagram.

3. Forgetting the curve over the peak

The line must rise to a hump between the reactants and products, not go straight across. The hump is what represents the activation energy barrier as bonds break and form.

4. Confusing activation energy with the overall energy change

Activation energy is the barrier to starting the reaction. The overall energy change is the difference between reactants and products. They are two separate arrows on the profile.

5. Saying no energy is needed for an exothermic reaction

Even exothermic reactions need the activation energy to get started. A reaction can release energy overall yet still require an initial input to overcome the barrier.

Key terms

Reaction profile
An energy level diagram showing how the energy of the chemicals changes as a reaction proceeds from reactants to products.
Activation energy
The minimum energy that colliding particles must have for a reaction to occur.
Overall energy change
The difference in energy between the products and the reactants, shown by the vertical gap between their levels on a reaction profile.

Frequently asked questions

Activation energy is the minimum amount of energy that colliding particles must have for a reaction to happen. On a reaction profile it is the difference in energy between the reactants and the top of the curve, shown as the height of the hump.

Compare the energy of the products with the reactants. If the products are lower than the reactants the reaction is exothermic; if the products are higher than the reactants it is endothermic.

A reaction profile shows the relative energies of the reactants and products, the activation energy needed to start the reaction, and the overall energy change, plotted against the progress of the reaction.

Generate revision on any topic you study

Type any topic you're studying and Aicademy generates a complete lesson, quiz, and flashcard set, personalised to your level.

Lessons on anything

Structured, level-matched lessons on any topic you study

Practice quizzes

Find out what you actually know before the exam does

Flashcard sets

Lock in key concepts with instant revision cards

Ask Aica

Stuck on something? Get a clear explanation, any time

Prev

Exothermic and Endothermic Reactions

Next

Bond Energy Calculations

Related lessons

Top students don’t revise more. They revise what counts.

Start revising free

Free to start. No card needed.