Sampling Techniques: Quadrats and Transects

Aligned to the AQA 8461 specification
- Topic
- Ecology
- Level
- Intermediate
- Reading time
- 12 min
- Published
- 16 June 2026
- Updated
- 16 August 2026
On this page
Key takeaways
- A quadrat is a square frame of known area used to sample organisms; for an abundance estimate it must be placed randomly so every part of the habitat has an equal chance of being sampled, removing bias.
- To estimate total population size, find the mean number per quadrat and multiply by the total habitat area divided by the area of one quadrat.
- A transect is a line across a habitat with quadrats at regular intervals, used to measure how distribution changes along an environmental gradient; the line itself is laid out deliberately, not randomly.
- Mean is the total divided by how many values there are; median is the middle value of the ordered data; mode is the most frequent value, and the median is less affected by extreme outliers.
- In a stable community, predator and prey populations rise and fall in linked cycles, with the predator peak coming shortly after the prey peak.
Quadrats and Why Random Sampling Matters
A quadrat is a square frame of known area (often or ) used to sample the organisms inside it. Counting every organism in a large habitat is impractical, so we sample a fraction of it and scale up.
For the sample to represent the whole habitat fairly, quadrats must be placed randomly. Choosing "good-looking" spots introduces bias — for example, deliberately placing quadrats where daisies are dense overestimates the population.
Random sampling means every part of the habitat has an equal chance of being sampled. This removes bias and makes the estimate representative.
To place quadrats randomly:
- Lay two tape measures at right angles along two edges of the area to form a grid of coordinates.
- Generate pairs of random numbers (from a calculator, random number table, or app).
- Use each pair as coordinates and place a quadrat at that point.
- Count the organisms of the target species inside each quadrat.
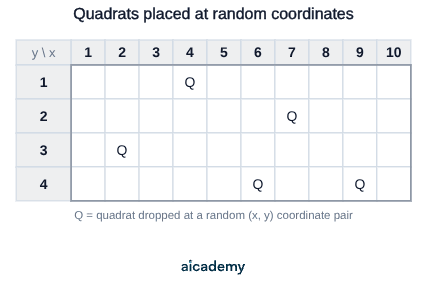
Quadrats are best for organisms that do not move (plants) or move very little (e.g. limpets, barnacles).
Want more lessons like this one?
Generate lessons on anything you study. Free account, no card needed.
Transects: Measuring Distribution Along a Gradient
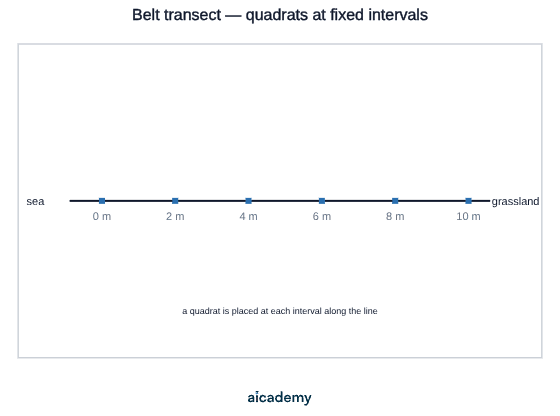
A transect is a line laid across a habitat along which quadrats are placed at regular intervals. Transects answer a different question from random quadrats: not "how many in total?" but "how does distribution change across an environmental gradient?"
A gradient is a gradual change in an abiotic factor — for example light decreasing from open ground into woodland, or moisture and salt changing from the sea up a beach.
Use random quadrats to estimate abundance or population size. Use a transect (a line of quadrats at set intervals) to study how distribution changes along a gradient. The transect line itself is not placed randomly — it is laid out along the factor you are investigating.
Method (belt transect):
- Lay a tape measure in a straight line from one end of the gradient to the other.
- Place a quadrat every fixed interval (e.g. every ).
- In each quadrat, count the target species (or estimate percentage cover for plants that are hard to count individually).
- Record the abiotic factor at each point (e.g. light level with a light meter).
The Predator-Prey Relationship
In a stable community, the numbers of predators and their prey rise and fall in linked cycles.
- When prey are plentiful, predators have lots of food, so the predator population grows.
- More predators eat more prey, so the prey population falls.
- With less food, predators starve and their numbers fall.
- Fewer predators means more prey survive, so the prey population recovers — and the cycle repeats.
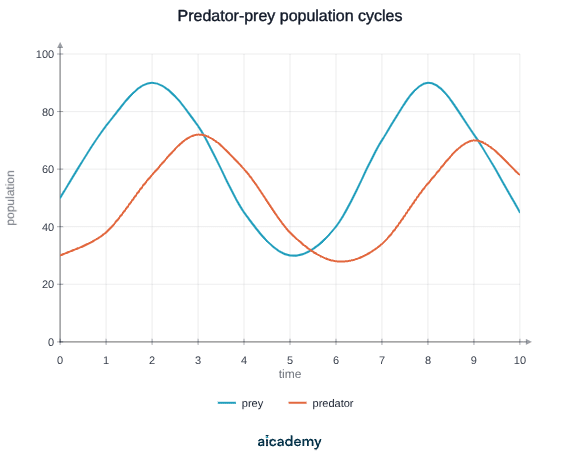
Two features you must be able to read from a predator-prey graph:
- The two curves are cyclical — they repeat up-and-down over time.
- The peaks are out of phase: the predator peak comes shortly after the prey peak, because predators only increase once there is already extra food.
(Extra context — the classic data set is the Canadian lynx and snowshoe hare from Hudson's Bay Company fur records. Naming it is not required by AQA 8461.)
Key terms
- Ecosystem
- The interaction of a community of living organisms with the non-living (abiotic) parts of their environment.
- Population
- All the organisms of one species in a habitat.
- Community
- All the populations of different species living together in a habitat.
- Quadrat
- A square frame of known area used to sample the organisms inside it.
- Random sampling
- Sampling in which every part of the habitat has an equal chance of being sampled, removing bias and making the estimate representative.
- Transect
- A line laid across a habitat along which quadrats are placed at regular intervals to study how distribution changes along a gradient.
- Gradient
- A gradual change in an abiotic factor across a habitat, such as light decreasing into woodland or moisture changing up a beach.
- Mean
- The arithmetic average, found by adding all values and dividing by how many there are.
- Median
- The middle value when the data is placed in order; it is less affected by extreme values than the mean.
- Mode
- The value that appears most often in a set of data.
- Interdependence
- The way species in a community depend on one another for things such as food, shelter, pollination and seed dispersal, so removing one can affect many others.
Frequently asked questions
Use randomly placed quadrats to estimate abundance or total population size. Use a transect, a line of quadrats at set intervals, to study how distribution changes along an environmental gradient. The transect line itself is laid out deliberately along the factor being investigated, not placed randomly.
Find the mean number of organisms per quadrat, then multiply by the total habitat area divided by the area of one quadrat. For example, a mean of 6 daisies per 1 m² quadrat in a 200 m² field gives an estimated 6 × 200 = 1200 daisies.
Predators can only increase once there is already extra prey to eat, so their numbers lag behind. When prey are plentiful predators grow, more predators reduce the prey, then predators starve and fall, allowing prey to recover, and the cycle repeats.
Generate revision on any topic you study
Type any topic you're studying and Aicademy generates a complete lesson, quiz, and flashcard set, personalised to your level.
Lessons on anything
Structured, level-matched lessons on any topic you study
Practice quizzes
Find out what you actually know before the exam does
Flashcard sets
Lock in key concepts with instant revision cards
Ask Aica
Stuck on something? Get a clear explanation, any time
Adaptations
The Water and Carbon Cycles
Related lessons
10 min
12 min