Track progress, take quizzes and save notes on this lesson.

Free forever · no card needed

Start free
Advanced

Rate of Photosynthesis and Limiting Factors

4.4.1.2 Rate of photosynthesis (Required practical 6)

Aligned to the AQA 8461 specification

Level
Advanced
Reading time
11 min
Published
16 June 2026
Updated
1 July 2026
On this page
  1. 1.The Four Factors That Affect the Rate
  2. 2.What "Limiting Factor" Means
  3. 3.Reading a Limiting-Factor Graph
  4. 4.Required Practical 6: Light Intensity and Pondweed
  5. 5.Calculating Rate from RP6 Data
  6. 6.Light Intensity and the Inverse Square Law (HT)
  7. 7.Interacting Factors and Greenhouse Economics (HT)
  8. 8.Common Exam Mistakes

Key takeaways

  • Four factors affect the rate of photosynthesis: light intensity, carbon dioxide concentration, temperature, and the amount of chlorophyll.
  • A limiting factor is the factor in shortest supply that holds back the rate; increasing any other factor makes no difference until the limiting one is raised.
  • On a rate graph, the rising part shows the x-axis factor is limiting; on the flat plateau, something else (such as CO2 or temperature) has become the limiting factor.
  • Temperature behaves differently from the other factors: the rate rises to an optimum and then falls as enzymes denature, rather than simply levelling off.
  • Required practical 6 measures how light intensity affects photosynthesis in pondweed by counting oxygen bubbles, using a heat shield or water bath to keep temperature constant.

The Four Factors That Affect the Rate

Photosynthesis is the reaction plants use to make glucose, summarised as carbon dioxide + water → glucose + oxygen (powered by light energy). The rate of photosynthesis is how fast this reaction happens — how much glucose or oxygen is produced per unit of time.

Four environmental factors change that rate:

FactorEffect of increasing itWhy
Light intensityFaster, then levels offLight supplies the energy that drives the reaction
Carbon dioxide concentrationFaster, then levels offCO₂ is a raw material for making glucose
TemperatureFaster up to an optimum, then fallsReactions are enzyme-controlled; too hot denatures the enzymes
Amount of chlorophyllFasterChlorophyll absorbs the light; more chlorophyll absorbs more light

The first three are conditions in the plant's surroundings. The amount of chlorophyll is a property of the plant itself — it can be reduced by disease, a lack of magnesium (needed to make chlorophyll), or leaf damage from herbivores.

Temperature behaves differently from the other three. Because photosynthesis depends on enzymes, the rate rises to an optimum and then falls as the enzymes denature — it does not simply level off.

What "Limiting Factor" Means

A limiting factor is the factor in shortest supply that holds back the rate. At any moment, the rate of photosynthesis is capped by whichever of the four factors is least available — increasing any of the others will make no difference until you raise the limiting one.

Think of it like baking. If you have plenty of flour and sugar but only one egg, the number of cakes you can make is limited by the eggs. Adding more flour does nothing; you must add eggs.

Definition to memorise: a limiting factor is the factor whose shortage is currently preventing the rate from increasing. Supply more of it and the rate rises; supply more of anything else and the rate stays the same.

A graph of rate against one factor shows this directly. It has two regions:

  • A rising part, where increasing the factor on the x-axis increases the rate — so that factor is limiting.
  • A flat part (plateau), where increasing the factor makes no further difference — so something else has become limiting (temperature, CO₂, or chlorophyll), or the plant is already working at full capacity.

Reading a Limiting-Factor Graph

Most exam graphs plot rate of photosynthesis on the y-axis against one factor (usually light intensity or CO₂ concentration) on the x-axis. Your job is to identify which factor is limiting in each region of the curve.

A light-intensity graph typically looks like this:
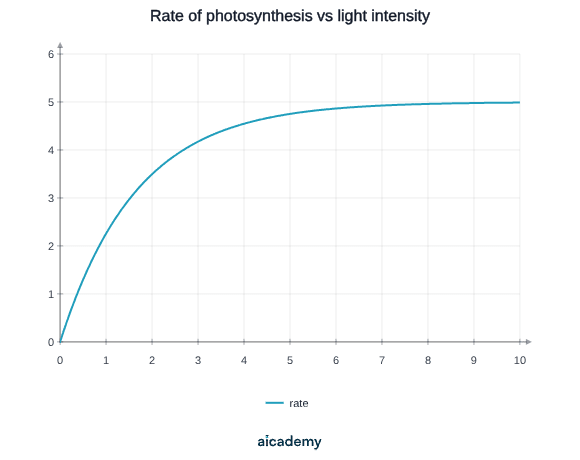
The curve rises steeply at low light (light is limiting), then plateaus (something else — CO₂ or temperature — becomes limiting).

Worked example 1 — naming the limiting factor in each region. A leaf is given more and more light at a fixed temperature and CO₂ level.

  • On the rising (steep) part: doubling the light roughly doubles the rate. Because changing light changes the rate, light intensity is the limiting factor here.
  • At the point the line bends: light stops being limiting.
  • On the flat part (plateau): adding more light does nothing, so light is no longer limiting. Something else — CO₂ concentration or temperature — is now the limiting factor.

To name the limiting factor: if increasing the x-axis factor raises the rate, that factor is limiting; if the rate is flat, the answer is "something other than the factor on the x-axis", i.e. CO₂ or temperature.

Required Practical 6: Light Intensity and Pondweed

Required practical 6 investigates how light intensity affects the rate of photosynthesis using an aquatic plant such as pondweed (e.g. Elodea or Cabomba). The plant is underwater, so the oxygen it produces escapes as bubbles — these can be counted, or the gas collected and its volume measured. Oxygen production is used as the measure of rate.
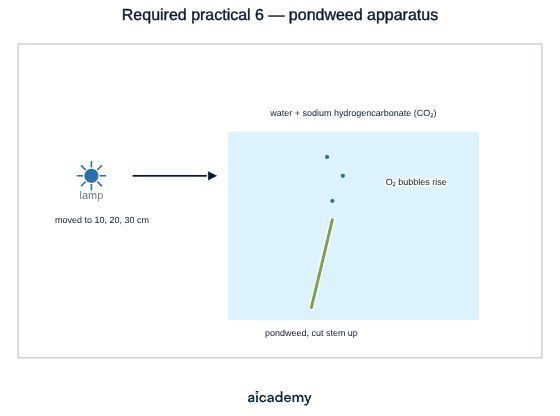
Method:

  1. Place a piece of pondweed, cut end up, in a beaker of water containing sodium hydrogencarbonate (this supplies a constant supply of CO₂).
  2. Put a lamp a measured distance from the beaker — distance controls light intensity.
  3. Leave the plant to acclimatise for a few minutes, then count the bubbles released in a fixed time (e.g. one minute), or collect the gas in a syringe/capillary tube and measure its volume.
  4. Repeat at a range of distances (e.g. 10, 20, 30, 40 cm) and repeat each distance to find a mean.

Controlling variables:

  • Place a glass tank of water (a heat shield) or a water bath between the lamp and the beaker so heat from the lamp does not warm the water — this keeps temperature constant.
  • Keep the same piece of pondweed, the same CO₂ supply, and the same time interval for every reading.

The heat shield matters: a lamp warms the water as well as lighting it. Without it, you would be changing temperature and light intensity at once, so you could not tell which one caused a change in rate.

Something not quite clicking?

Ask Aica to explain any part of this differently. Free, takes 30 seconds.

Ask Aica

Calculating Rate from RP6 Data

The rate is the amount of oxygen produced per unit time — either bubbles per minute or volume of gas per minute:

Worked example 2 — rate from bubble counts. At a distance of 10 cm the pondweed releases 60 bubbles in 2 minutes.

If at 20 cm it releases 45 bubbles in 90 seconds, first convert to a consistent unit. In bubbles per second that is bubbles/s, which is bubbles per minute — so always state the time unit you used.

A typical set of results, with distance converted to a relative light intensity, looks like this:

Distance of lamp (cm)Bubbles in 1 minuteRate (bubbles/min)
103030
2088
3044
4022

The rate is highest when the lamp is closest (brightest light) and falls sharply as the lamp moves away. Counting bubbles is quick but imprecise (bubbles vary in size); measuring the volume of gas collected is more reliable.

Light Intensity and the Inverse Square Law (HT)

(Higher Tier only — the inverse square law and inverse proportion are assessed only on the Higher Tier paper.)

Light spreads out as it travels, so moving the lamp away dims the plant faster than you might expect. Light intensity is inversely proportional to the square of the distance:

where is the distance from the lamp. Doubling the distance does not halve the light — it quarters it.

Worked example 3 — distance doubling from 10 cm to 20 cm. Compare the relative light intensity at each distance using :

Dividing the two values: . So at twice the distance the light intensity falls to one quarter (), not one half. This is why doubling the distance causes the rate to drop so steeply in RP6.

A useful table for converting lamp distance to relative light intensity (taking 10 cm as 1.00):

Distance (cm)Relative light intensity (10 cm = 1.00)
100.01001.00
200.00250.25
300.00110.11
400.0006250.06

Plotting rate against relative light intensity () rather than against distance gives a graph that is much easier to interpret, because the x-axis is then proportional to the actual light reaching the plant.

Interacting Factors and Greenhouse Economics (HT)

(Higher Tier only — interpreting graphs of two or three factors, deciding which is limiting, and greenhouse economics are Higher Tier content.)

In real conditions the factors interact, and any one of them may be the limiting factor. Exam graphs often show two or three curves at once.

Reading a two-line graph. Imagine rate plotted against light intensity, with one curve at a low CO₂ level and one at a high CO₂ level:

  • On the steep rising part, both curves climb together — light is limiting for both.
  • The low-CO₂ curve plateaus first and lower: once light is plentiful, the limited CO₂ caps its rate.
  • The high-CO₂ curve plateaus higher, showing CO₂ was the limiting factor on the lower curve's plateau.

To decide the limiting factor on a multi-line graph: on the plateau, the factor that differs between the lines (and lifts the rate when increased) is the one that was limiting.

Greenhouse economics. A grower can raise the rate of photosynthesis — and so the crop yield — by artificially increasing light (lamps), warmth (heaters) and CO₂ (e.g. burning fuel or using a CO₂ generator). But each of these costs money. The aim is the most cost-effective combination: enhance a condition only while the extra crop value is greater than the extra cost. Pushing one factor far higher once another has become limiting wastes money for no extra yield.

EnhancementBenefitCost to consider
Artificial lightingMore light when natural light is lowElectricity for lamps
HeatersKeeps the optimum temperature in winterFuel/electricity
Adding CO₂Removes CO₂ as a limiting factorFuel or bottled CO₂

The grower balances these so the extra income from a higher yield outweighs the running costs — maximising profit, not just rate.

Common Exam Mistakes

1. Saying the rate "increases forever" with more light

On a light-intensity graph the rate levels off once another factor (CO₂ or temperature) becomes limiting. Describe the curve in two parts: rising while light is limiting, then a plateau.

2. Naming light as the limiting factor on the flat part of the graph

On the plateau, increasing light does nothing, so light is not limiting there. The limiting factor on a flat region is something other than the x-axis factor — usually CO₂ concentration or temperature.

3. Thinking doubling the lamp distance halves the light (HT)

Light intensity follows , so doubling the distance quarters the intensity. Use , not , in any inverse-square calculation.

4. Treating temperature like the other factors

Light, CO₂ and chlorophyll raise the rate until it plateaus. Temperature raises it to an optimum and then the rate falls as enzymes denature — it does not simply level off.

5. Forgetting to control temperature in RP6

A lamp heats the water as well as lighting it. Without a heat shield or water bath, you change temperature and light intensity together, so the experiment is not a fair test.

6. Counting bubbles and calling it accurate

Bubble counts are quick but unreliable because bubbles vary in size and can be missed. State that measuring the volume of oxygen collected is the more precise method, and that repeats are needed to find a mean.

Key terms

Rate of photosynthesis
How fast photosynthesis happens, measured as how much glucose or oxygen is produced per unit of time.
Limiting factor
The factor in shortest supply that holds back the rate of photosynthesis; raising it increases the rate, while raising others does not.
Optimum temperature
The temperature at which the enzyme-controlled rate of photosynthesis is highest; above it the rate falls as enzymes denature.
Inverse square law
The relationship that light intensity is inversely proportional to the square of the distance from the lamp, so doubling the distance quarters the intensity.
Sodium hydrogencarbonate
A substance added to the water in Required practical 6 to provide a constant supply of carbon dioxide for the pondweed.
Plateau
The flat part of a rate graph where increasing the x-axis factor makes no further difference, because something else has become limiting.

Frequently asked questions

A limiting factor is the factor in shortest supply that is currently preventing the rate of photosynthesis from increasing. Supplying more of it raises the rate, but supplying more of anything else makes no difference until the limiting factor is increased.

If increasing the factor on the x-axis raises the rate (the rising part of the curve), that factor is limiting. If the rate is flat on the plateau, the limiting factor is something other than the x-axis factor, usually carbon dioxide concentration or temperature.

Light intensity is inversely proportional to the square of the distance (1/d²), not 1/d. Doubling the distance quarters the intensity rather than halving it. For example, going from 10 cm to 20 cm drops the relative light intensity from 1.00 to 0.25.

Generate revision on any topic you study

Type any topic you're studying and Aicademy generates a complete lesson, quiz, and flashcard set, personalised to your level.

Lessons on anything

Structured, level-matched lessons on any topic you study

Practice quizzes

Find out what you actually know before the exam does

Flashcard sets

Lock in key concepts with instant revision cards

Ask Aica

Stuck on something? Get a clear explanation, any time

Prev

Photosynthesis and Uses of Glucose

Next

Aerobic and Anaerobic Respiration

Related lessons

8 min

11 min

Top students don’t revise more. They revise what counts.

Start revising free

Free to start. No card needed.