Break-Even Analysis

Aligned to the Pearson Edexcel 1BS0 specification
- Level
- Intermediate
- Reading time
- 8 min
- Published
- 14 June 2026
- Updated
- 16 August 2026
On this page
Key takeaways
- Break-even output is calculated by dividing fixed costs by contribution per unit, where contribution = selling price minus variable cost per unit.
- The margin of safety is actual output minus break-even output; it shows how far sales can fall before the business makes a loss.
- On a break-even diagram the total cost line starts at the fixed cost value (not the origin), while the revenue line starts at zero.
- If fixed or variable costs rise, the break-even point moves right (more units needed); if the selling price rises, the break-even point moves left.
- Break-even analysis assumes all output is sold at a constant price, which is rarely true in practice, so it is a planning tool rather than a precise forecast.
The Break-Even Diagram
A break-even diagram plots revenue and costs against output on a graph. Examiners may ask you to sketch, interpret, or annotate one.
The diagram below plots the phone case business (fixed costs £5,000, selling price £20, variable cost £12 per unit). The revenue and total cost lines cross at 625 units — the break-even point.
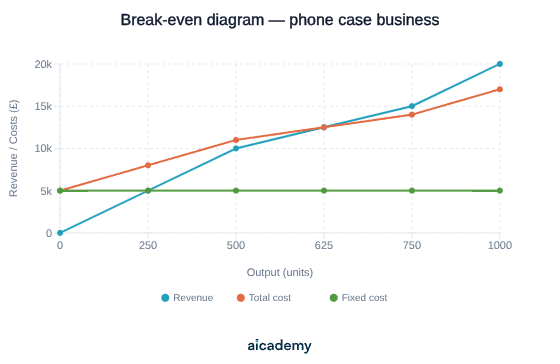
Key features of the diagram:
| Feature | Description |
|---|---|
| Fixed cost line | Horizontal — same value at every output level |
| Total cost line | Starts at the fixed cost on the y-axis; slopes upward (adds variable costs) |
| Revenue line | Starts at the origin (0 units = £0 revenue); slopes upward |
| Break-even point | Where the revenue line and total cost line cross |
| Loss zone | To the left of break-even — total costs exceed revenue |
| Profit zone | To the right of break-even — revenue exceeds total costs |
| Margin of safety | Horizontal distance between current output and break-even output |
The steeper the revenue line compared to the total cost line, the fewer units are needed to break even.
Something not quite clicking?
Ask Aica to explain any part of this differently. Free, takes 30 seconds.
Key terms
- Break-even output
- The level of production at which total revenue exactly equals total costs, so the business makes neither a profit nor a loss.
- Contribution per unit
- Selling price minus variable cost per unit; each unit's contribution towards covering fixed costs and, beyond break-even, generating profit.
- Fixed costs
- Costs that do not change with the level of output, such as rent and insurance, represented as a horizontal line on the break-even diagram.
- Variable costs
- Costs that change directly with output, such as raw materials; their cumulative total is added to fixed costs to give the total cost line.
- Margin of safety
- The difference between actual output and break-even output, showing how far sales can decline before the business makes a loss.
- Total cost line
- On a break-even diagram, the line that starts at the fixed cost on the y-axis and slopes upward as variable costs are added with each unit produced.
Frequently asked questions
First find contribution per unit (selling price minus variable cost per unit), then divide fixed costs by that contribution. For example, fixed costs of £5,000 and contribution of £8 per unit gives a break-even output of 625 units.
The margin of safety is actual output minus break-even output, measured in units. It shows how much output could fall before the business starts making a loss. A larger margin of safety means the business is less financially vulnerable.
It assumes all output is sold and that selling price and variable cost per unit stay constant, which rarely holds. It also ignores external changes such as competition or recession, making it more useful as a planning estimate than an accurate prediction.
Generate revision on any topic you study
Type any topic you're studying and Aicademy generates a complete lesson, quiz, and flashcard set, personalised to your level.
Lessons on anything
Structured, level-matched lessons on any topic you study
Practice quizzes
Find out what you actually know before the exam does
Flashcard sets
Lock in key concepts with instant revision cards
Ask Aica
Stuck on something? Get a clear explanation, any time
Revenue, Costs and Profit
Cash Flow
Related lessons
8 min
8 min
8 min