Geographical Skills: Maps, Graphs and Data Techniques

Aligned to the AQA 8035 specification
- Topic
- Geographical skills
- Level
- Foundational
- Reading time
- 17 min
- Published
- 10 June 2026
- Updated
- 9 September 2026
On this page
- 1.OS Maps: Grid References, Scale, Direction and Spot Heights
- 2.OS Maps: Contours, Cross-Sections and Map Interpretation
- 3.Specialist Maps: Choropleth, Isoline, Flow-line and More
- 4.Graphical Skills: Core Graph Types
- 5.Graphical Skills: Scatter Graphs and Cumulative Frequency
- 6.Numerical and Statistical Skills
- 7.Fieldwork Skills
- 8.Common Exam Mistakes
Key takeaways
- On OS maps a four-figure grid reference identifies a 1 km square and a six-figure reference pinpoints a point within about 100 m; always read eastings (along) before northings (up).
- On contour maps, close contours mean a steep slope, widely spaced contours a gentle slope, concentric circles a hilltop, and a V pointing uphill a valley; a cross-section is plotted as a smooth profile, not a staircase.
- Scatter graphs show correlation: positive means both variables rise together, negative means one falls as the other rises; a line of best fit allows interpolation within the data and extrapolation beyond it.
- Central tendency uses mean, median and mode, while spread uses range, quartiles and the interquartile range (Q3 minus Q1), which is resistant to outliers.
- Statistics can mislead through cherry-picked time periods, truncated y-axes, using the mean for skewed data, percentages without absolute context, and misleading choropleth class intervals.
Graphical Skills: Core Graph Types
Line graphs:
- Continuous data over time; describe: overall trend, rate of change, peaks and troughs; quote data values
Bar graphs:
- Discrete categories; vertical or horizontal; compound/stacked bar: components within each bar; divided bar (100% bar): proportional
Histograms:
- Show frequency distribution of data grouped into equal class intervals; bars touch each other (no gaps) — this distinguishes histograms from bar charts
- The x-axis shows the continuous variable (e.g. rainfall amount, age group); the y-axis shows frequency; useful for showing whether data is normally distributed, skewed, or bimodal
Pictograms:
- Use symbols or pictures to represent data; each symbol represents a fixed number (e.g. each figure = 1 million people)
- Advantage: visually engaging; easy to read; limitation: imprecise (half-symbols are hard to read accurately)
Pie charts:
- Proportional composition; 360° = 100%; calculate degrees: (percentage ÷ 100) × 360
Triangular graphs:
- Three-axis graph for data summing to 100% across three variables (e.g. % primary, secondary, tertiary employment); read each axis parallel to its own grid lines
Plotting data on a provided graph: When given a pre-drawn graph with labelled axes and a scale, plot the given data accurately. For a bar chart: draw a bar to the correct value. For a line graph: place a cross (×) at each coordinate, then join with a straight line. For a scatter graph: plot each (x, y) pair as a point. Read the scale carefully — a common error is misreading the interval (e.g. treating 2-unit intervals as 1-unit intervals).
Dispersion diagrams:
- All individual data values plotted on a single vertical scale; show spread, clustering, and outliers; less useful than a line graph for showing temporal patterns
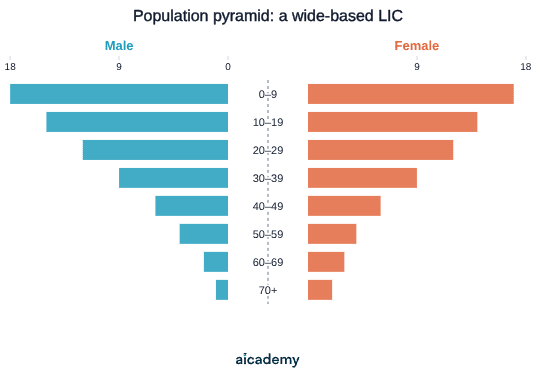
Population pyramids:
- Bar chart of age-sex structure; females right, males left; youngest at base
| Shape | Characteristics | Development stage |
|---|---|---|
| Wide base, rapid taper | High birth rate; high death rate; short life expectancy | LIC / DTM Stage 2 |
| Narrowing base, expanding middle | Falling birth rate; falling death rate | NEE / DTM Stage 3 |
| Narrow base, bulge in middle | Low birth rate; low death rate; ageing population | HIC / DTM Stage 4–5 |
The pyramid below shows a wide-based LIC structure: large numbers of young people and a rapid taper towards old age.
Something not quite clicking?
Ask Aica to explain any part of this differently. Free, takes 30 seconds.
Graphical Skills: Scatter Graphs and Cumulative Frequency
Scatter graphs:
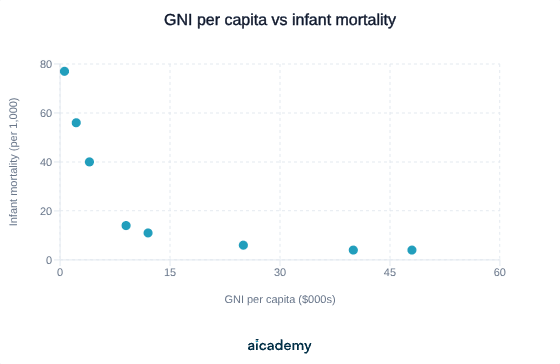
- Show the relationship (correlation) between two variables; each point = one observation
- Positive correlation: as x increases, y increases (GNI per capita vs. life expectancy)
- Negative correlation: as x increases, y decreases (birth rate vs. GNI per capita)
- No correlation: random scatter; no relationship
The scatter below shows a negative correlation: as GNI per capita rises, infant mortality falls.
Line of best fit:
- A straight line through the middle of the point cluster; roughly equal numbers of points on each side
- Used for interpolation: estimating the y-value for an x-value within the data range by reading off the best-fit line
- Used for extrapolation: estimating a value beyond the data range by extending the best-fit line; less reliable because the trend may not continue
Prediction from scatter plots: "If a country has a GNI per capita of $10,000, what would you predict its life expectancy to be?" → find $10,000 on x-axis, go up to the line of best fit, read across to the y-axis.
Cumulative frequency graphs:
- Plot cumulative (running total) frequency against the upper boundary of each class interval; produces a curve (S-shaped)
- Reading quartiles from cumulative frequency curve:
- Median (Q2): draw horizontal line from 50% of total frequency; read down to x-axis
- Lower quartile (Q1): from 25% frequency
- Upper quartile (Q3): from 75% frequency
- Interquartile range (IQR): Q3 − Q1; the middle 50% of the data
- Reading percentiles: draw horizontal line from desired percentage (e.g. 90th percentile from 90%); read down to x-axis
Key terms
- Grid reference
- A set of numbers using eastings and northings to locate a feature precisely on an OS map; four-figure gives a 1 km square, six-figure gives roughly 100 m precision.
- Spot height
- A black dot on a map with a number showing the exact height in metres above sea level at that point.
- Contour
- A line on a map connecting points of equal height above sea level; spacing indicates slope steepness.
- Choropleth map
- A map with areas shaded in different colours or densities to show how a variable varies between regions, with darker shading meaning higher values.
- Isoline map
- A map where lines connect points of equal value, such as temperature, pressure or rainfall, with closely spaced lines showing a steep gradient.
- Interquartile range (IQR)
- The range of the middle 50% of ranked data, calculated as the upper quartile minus the lower quartile (Q3 minus Q1); it is resistant to outliers.
- Interpolation
- Estimating a value within the range of the data, for example by reading off a line of best fit.
- Extrapolation
- Estimating a value beyond the range of the data by extending a line of best fit; less reliable because the trend may not continue.
- Population pyramid
- A bar chart of a population's age-sex structure, with males on the left, females on the right, and the youngest age groups at the base.
Frequently asked questions
A four-figure grid reference uses two digits for the easting and two for the northing to identify a 1 km by 1 km square. A six-figure reference adds an estimated tenth to each, using three digits each, to pinpoint a location within about 100 m. In both, read the easting (along) before the northing (up).
Draw a horizontal line from 50% of the total frequency and read down to the x-axis for the median (Q2), from 25% for the lower quartile (Q1), and from 75% for the upper quartile (Q3). The interquartile range is Q3 minus Q1, covering the middle 50% of the data.
Quote specific data values, units and dates from the source rather than writing vaguely. For example, write that global population grew from 2.5 billion in 1950 to about 8.1 billion in 2024, an increase of over 200%, and describe the overall trend, the rate of change, and any peaks, troughs or anomalies.
Generate revision on any topic you study
Type any topic you're studying and Aicademy generates a complete lesson, quiz, and flashcard set, personalised to your level.
Lessons on anything
Structured, level-matched lessons on any topic you study
Practice quizzes
Find out what you actually know before the exam does
Flashcard sets
Lock in key concepts with instant revision cards
Ask Aica
Stuck on something? Get a clear explanation, any time
Food Security: Insecurity, Strategies and Sustainability
Geography Exam Technique: Command Words and Extended Writing